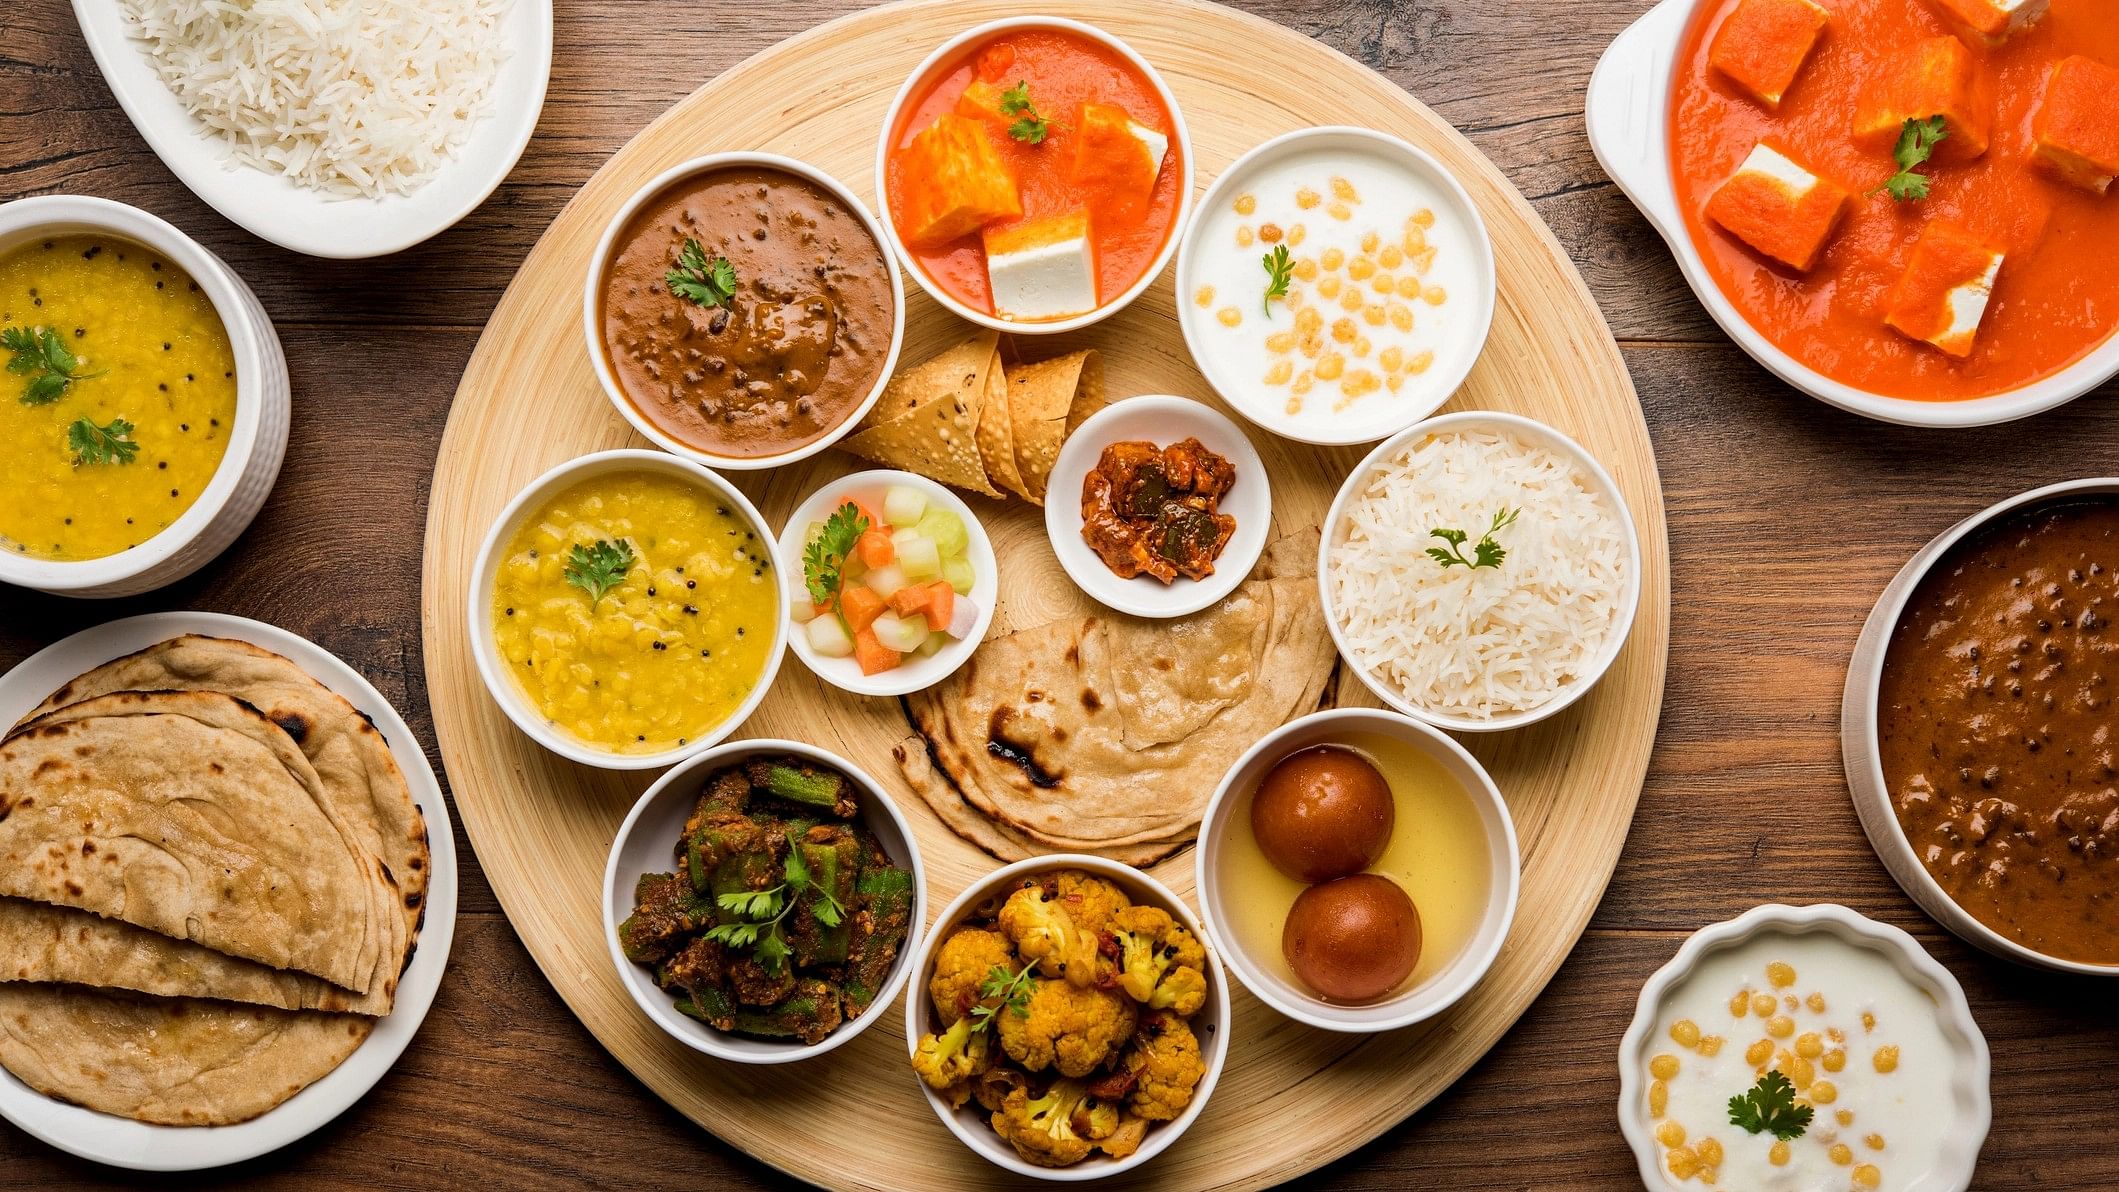
Representative image of a vegetarian thali.
Credit: iStock Photo
Chief Economic Advisor Krishnamurthy Subramanian added some spice to the Economic Survey in the Union Budget 2020 by introducing 'Thalinomics' - India's take on the consumption index.
In order to inform the general public about changes in food and beverage prices, the Centre used the ubiquitous "thali."
The Centre sought to find out whether a thali has become more or less affordable for the common man, in the 27-page chapter on 'Thalinomics: The Economics of a Plate of Food in India' in the Economic Survey 2020.
Using the National Institute of Nutrition's dietary guidelines for Indians, economists calculated the price of a thali and mapped it with price data from the Consumer Price Index for Industrial Workers for around 80 centers across 25 states and Union Territories from April 2006 to October 2019.
Thalinomics: What did it indicate?
When it comes to vegetarian thali, the survey discovered that a person could purchase the same quantity of thalis from about 50 per cent of his daily wage in 2019–20 (April to October) compared to 2006–07, when that person would have spent about 70 per cent of his daily wage on two thalis for a household of five.
Between 2006–07 and 2019–20 (April to October), the share of wages required decreased from approximately 93 per cent to approximately 79 per cent, making non-vegetarian thalis more affordable.
The least expensive thali in 2019–20 was found in Jharkhand, where two vegetarian thalis for a family of five cost roughly 25 per cent of an employee's daily wage.
According to the survey, 2015–16 can be regarded as a year when the dynamics of thali prices changed. Since 2014–2015, a number of reform initiatives have been put forth to improve the productivity of the agricultural industry as well as the efficacy and efficiency of agricultural markets to enable better and more transparent price discovery.