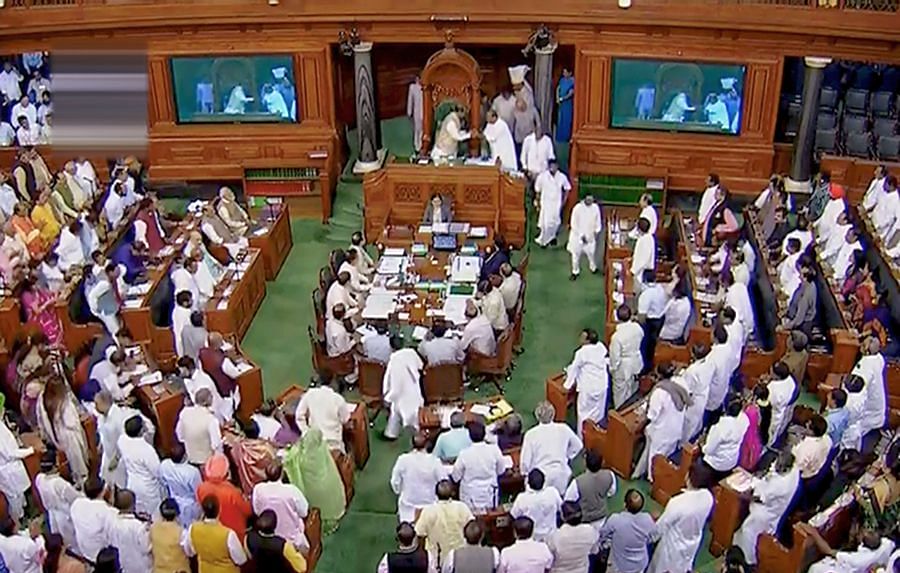
The 17th Lok Sabha kicked off its budget session on June 17. Taking a closer look, this Lok Sabha has a number of differences as compared to the previous one.
Composition according to age
The average age of MPs this term is 54 years and 194 members (36 per cent) fall within the age group of 25 – 50 years while 343 (64%) fall within the age group of 51 – 80 years. Two members are more than 80 years of age.
This term has fewer MPs above the age of 70 and more below the age of 40.
Twelve per cent of the elected members are below the age of 40 years and only six per cent above the age of 70 years.
This is higher compared to the 16th Lok Sabha where only eight per cent were below the age of 40 years.
However, during the first Lok Sabha of newly independent India, 26 per cent of the MPs were below the age of 40. This trend has seen a steady decline over the years. But this time, Lok Sabha checks this long-term trend of the lower house growing old.
More Women
Of the 716 women who contested in this Lok Sabha election, only 78 made it to the house.
The proportion of women in the Lok Sabha has increased over the years. In the beginning, they comprised only five per cent of the house, today they make up 14 per cent.
However, in comparison to other nations such as Rwanda with 61 per cent, South Africa with 43 per cent and Bangladesh with 21 per cent, representation of women in India falls short.
The 17th Lok Sabha not only has more female legislators but is also younger to their male counterparts.
National or regional party
India is a multi-party democracy. The political sphere is dotted with both national, regional and independent candidates.
Out of the 542 members of Parliament, 397 members have been elected from national parties. The BJP has the highest number with 303 members.
The national parties -- Congress and Trinamool Congress -- got 52 and 22 seats respectively. Among the regional parties, the Dravida Munnetra Kazhagam (DMK) with 23 and Yuvajana Sramika Raithu Congress Party (YSRC) with 22 won the highest number of seats.
Debut
There are 267 first-time MPs in this Lok Sabha. However, the number of first-timers this time is lower compared to 2014 when there were 314 new faces.
From the 16th Lok Sabha, 230 members have been re-elected for this term. The number of re-elected members are higher this time. In 2014, 169 members were re-elected.
From earlier Lok Sabhas, 45 members have been re-elected for this term.
Crorepatis
It is a rich Parliament this time where 88 per cent of the lawmakers are ‘crorepatis’ with Rs 20.93 crore as average assets of the winning candidates.
Out of 303 winning candidates of BJP, 265 are crorepatis followed by the Congress with 43 among the 51 winners.
Among the regional party, DMK has 22 crorepatis out of 23 winning candidates.
However, Nakul Nath, Kaml Nath’s son, tops the list as the richest MP with declared assets worth over Rs 660 crore.
Education and occupation
When compared to the 16th Lok Sabha where 20 per cent of the representatives had studied till class 12, the 17th Lok Sabha has more number of representatives (27 per cent) who have studied up to class 12. 394 members are at least graduates.
Since 1996, each Lok Sabha had at least 75 per cent of the MPs holding a graduate degree.
Most members of Lok Sabha (39 per cent) are involved in political or social work. This is closely followed by members involved in agriculture at 38 per cent, unlike in 2014 when most members were involved in agriculture. Businessmen make up 23 per cent of the House.